15 Ground-Breaking Digital Marketing Statistics
What’s the state of digital marketing in 2021?
We dug deep to see what the latest digital marketing statistics have to say.
While we’re firm believers benefits of digital marketing, we’ll also consider the good and bad sides of more traditional techniques and their relevance in certain contexts.
What’s more:
We’ll cover the most recent advertising facts, giving a comprehensive picture of this modern phenomenon that arguably makes the world as we know it go round.
Excited? Let’s crack on.
Essential Digital Marketing Stats (Editor’s Choice)
- Global spending on digital marketing will amount to US$455 billion in 2021.
- Canada and the US account for more than 40% of global digital marketing spending.
- Canada’s internet ad revenue was at around $8.7 billion in 2019.
- Search engine ads contribute the most to global digital ad expenses – US$72 billion per year.
- More than 63% of small- to medium-sized enterprises have digital marketing strategies.
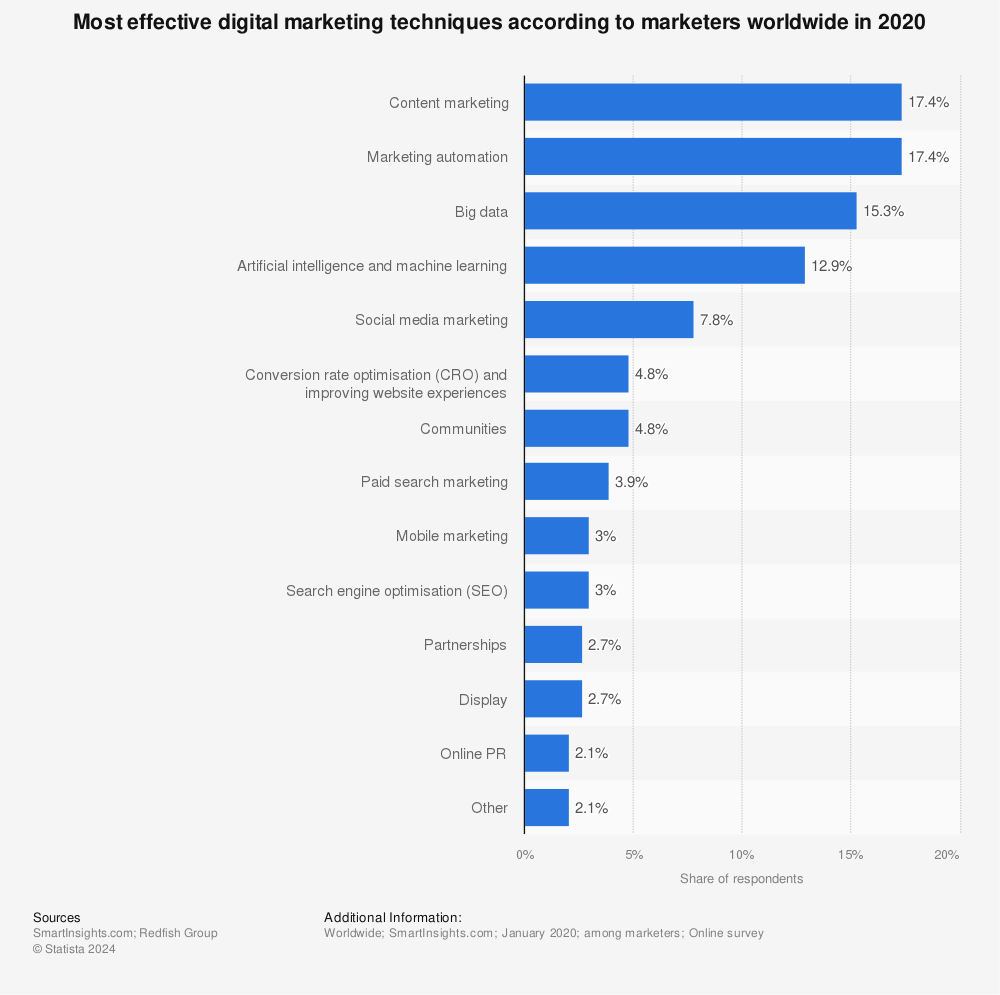
- Content marketing strategies are the most efficient, with up to a 20% success rate.
- They are followed by artificial intelligence and machine learning-generated content (14%), big data-fueled marketing (14%), and social media marketing (10%).
- The US spends around US$6 billion on B2B marketing every year.
Traditional Marketing vs Digital Marketing Statistics
1. Companies still pay a lot of money for traditional ads – US$10.4 billion a year in the US alone.
(Source: Statista, Statista)
And this stat only accounts for out-of-home (OOH) advertising in 2019 – which entails billboards, posters, arena and stadium ads, etc. Even though the COVID-19 pandemic reduced the relevance of traditional marketing, experts expect it to grow over the next few years.
In addition:
Billboard ad revenue in the US was around US$5.46 billion in 2019. Globally, we will spend around US$34 billion on OOH ads in 2021, with Amazon the largest single outdoor advertiser. Compared to 2020, when outdoor ad expenditure was around US$29.6 billion, this is already an improvement. In 2022, expenditures are expected to rise even further to US$37 billion.
2. In 2020, online marketing accounted for 51% of all marketing expenses globally.
(Source: Statista)
According to digital marketing statistics for 2020, the internet leads the pack by a country mile when it comes to marketing spending. It’s followed by TV (28.35%), newspaper (6.04%), outdoor (5.4%), magazines (3.4%), and, finally, cinema (0.4%).
Once again, we can see that traditional marketing media, such as TV and newspapers, still receive significant funds for advertising.
General Digital Marketing Statistics
3. Digital marketing spending will reach US$455.3 billion in 2021.
(Source: Statista)
According to digital marketing statistics for 2021, the COVID-19 pandemic only furthered the trend of rising digital advertising expenses. This market trend is expected to continue, with spending skyrocketing to an eye-watering 645US$ billion in 2024, thanks to a record 15.4% digital marketing industry growth rate.

4. Canada and the US account for more than 40% of global Internet marketing spending.
(Source: Statista)
Back in 2000, North America accounted for almost 80% of the market. However, the rest of the world has caught up in the last 20 years. On the other hand, Eastern Europe, the Middle East and Africa, and Latin America, still have quite low contributions to global internet marketing expenses.
What’s more:
One of the most important digital marketing facts of 2021 is that we are witnessing a gradual global shift. Asia-Pacific is likely to overtake Canada and the US in the years to come, reflecting the rising power of China.
5. Canada and the US are also leading the pack in terms of mobile ads.
(Source: Statista, Statista)
With US$105 billion spent by the US and 7.2$ billion invested in mobile ads by Canada, North America is by far the largest player in this field. Respectively, this is 39% and 54% of the two countries’ respective digital marketing market shares.
The thing is:
According to the most recent website traffic statistics, the biggest contributors to digital ad spending are search engines (US$72 billion), social media (US$47 billion), banner ads (US$30 billion), video ads (US$16 billion), and, finally, classifieds (US$3 billion).
6. Canada marked an $8.7 billion digital ad revenue in 2019, market trends reveal.
(Source: Statista)
Just how fast Canada’s digital ad revenue has grown is apparent when we compare the recent stats with those from 2002, when annual digital ad revenue stood at around $237 million. The growth really started to accelerate about 2014, when incremental growth was around $1 billion.
7. Canada’s internet ad spending share amounted to 56.6% in 2021, internet stats confirm.
(Source: Statista, Statista)
Here, we see the same trend as with digital ad revenue. Between 2015 to 2021, the internet ad spending share increased from 30.5% to 56.6%. It’s predicted to grow up to 62.5% in 2024.
You might be wondering:
How about the types of ads and their relative share in ad spending?
Here’s how things stand, according to the latest digital marketing statistics:
- Retail – 21%
- Auto – 19%
- Financial – 14%
- Packaged goods – 11%
- Technology – 6%
- Leisure and travel – 6%
- Telecom – 6%
- Entertainment – 4%
- Pharma – 3%
8. With a 20% success rate, content marketing is the most effective digital marketing technique by far.
(Source: Statista)
While content marketing statistics are pretty favourable for investors, other techniques, like artificial intelligence and machine learning (14%), big data (14%), social media marketing (10%), marketing automation (9%), mobile marketing (9%), conversion rate optimization (5%), SEO (4%), and communities (3%) show less encouraging statistics.
What’s perhaps most surprising are the SEO stats – there’s so much online about SEO, so many courses, coaches, and whatnot, and all for a 4% success rate.
Needless to say, these digital advertising statistics are somewhat simplified. There’s a lot more to consider when evaluating the effectiveness of marketing techniques. But the basic idea remains the same – digital marketing, much like traditional marketing, is not as effective as it could be.
Find more statistics at Statista
But what do business owners think?
9. 59% of business owners say social media website marketing increases sales.
(Source: Statista)
Additionally, 78% of business owners believe social media marketing increases traffic, and 60% say it improves fan loyalty. We see how the perception can be different from what we get from social media marketing statistics, to mention only one type of digital media marketing.
10. 63% of SMEs in the US already employ digital marketing.
(Source: Statista, Statista)
SMEs are catching up with the big guys. According to small business digital marketing statistics from 2016, only around 26% of American SMEs planned to utilize digital marketing. The remaining 10% of small businesses were looking to do so in the near future.
However, when it comes to posting social media ads, only 34% of SMEs were employing them in 2016. 27% planned to do so in the near future, while 37% did not consider them.
B2B Digital Marketing Statistics
11. According to digital marketing statistics, US$6 billion is spent on B2B digital marketing each year in the US alone.
(Source: Statista, Statista)
Business-to-business marketing has seen significant shifts in the last few decades. This field is traditionally dominated by very specific marketing forms, often unlike those utilized in consumer marketing.
More specifically:
Traditional B2B marketing events, like trade shows, will probably reach US$40 billion in investments in 2023. As a comparison, in 2018, B2B trade show spending was US$34.4 billion.
Key takeaway:
While it’s unlikely that digital marketing will completely replace traditional B2B techniques, the tech revolution is clearly changing the face of B2B marketing. Click To Tweet12. B2B traditional marketing spendings decreased by 50% during the Coronavirus pandemic, marketing statistics confirm.
(Source: Statista)
This data shows how limitations of movement and gathering have hurt the usual ways businesses used to communicate with each other and present their products.
The good news is:
The digital marketing industry has started to fill the gap created by the pandemic, with more and more businesses using Facebook, Instagram, and Twitter to reach out to other businesses.
Web Stats
13. Clima, with 162.3 million searches, and tiempo, with 151 million, are some of the most popular keywords on search, Google statistics reveal.
(Source: SEMRush, TrendsGoogle)
Needless to say, the internet is decentralized. So, we’re most definitely going to see the rest of the world catching up with the likes of the US and Europe. What this means is that foreign keywords will become more important – like the Spanish words clima and tiempo, for instance
We also see Cricbuzz, the Indian betting website, topping the list of most searched words, with 162 million in March 2021.
So, not only will digital marketers have to include languages other than English in their work, but also other cultural trends.
Now:
In 2021, Google search stats were of course dominated by the Coronavirus. At the same time, we also see things like Playstation 5, Kobe Bryant, Las píldoras de mi novio, La cabana, etc. In other words, the trend we’ve identified for March 2021 is not an isolated incident.
14. Internet use is on the rise, with 4.66 billion active users worldwide.
(Source: Statista)
It’s not surprising to see companies focusing more and more on search statistics. The internet is slowly but steadily reaching all corners of the world – even in countries that are still regarded as developing.
And that’s not all:
There are also 4.32 billion mobile phone users, 4.2 billion social media users, and 4.15 billion mobile social media users. Let that sink in for a minute.
Next:
15. Older users are 3 times less likely to skip through YouTube ads than younger users.
(Source: MarketingDive, PRNewswire)
Marketing demographics are affecting the acceptance rate of various new digital techniques. Age, for instance, is a significant factor in determining how much attention people pay to YouTube ads, for example.
Here’s the scoop:
Those 45 and older are far more likely to pay attention to video ads. At the same time, there’s a more general trend of increasing attention to ads across the board. This is probably a reflection of improving digital marketing strategies and content placement.
In Conclusion
Digital marketing is a game-changer. It has helped big companies reach the levels of recognition and presence unheard of in the age of traditional marketing. At the same time, digital marketing allows small businesses to compete with others via social media presence and user engagement.
However, we are already seeing an abyss that separates the big and small players due to the surging price of online ads and marketing space on platforms like Google, YouTube, and Instagram.
Is that trend likely to continue? We’ll keep monitoring the latest digital marketing stats to keep you posted.
FAQ
Digital marketing is any marketing technique or strategy that uses technologies like the internet, mobile phones and apps, VR, video games, and so on. The purpose of digital marketing is the same as that of traditional marketing, but the ways of improving sales and other metrics are different.
Additionally, interactive marketing is easier to achieve via digital marketing. Getting consumers to be active is much easier when you have new technologies and a solid internet presence.
It depends on the type of digital marketing we’re talking about. Content marketing strategies (20%), AI-generated content (14%), and big data (14%) are by far the most effective strategies. Social media marketing (10%) and SEO (4%) are somewhat less effective.
It has to be noted that all techniques and strategies have certain effects – whether it’s increasing public awareness of the product, increasing sales, views, or building a more loyal fan base.
The effect of each technique also depends on external factors, such as demographics, time of year (holiday season, for instance), personality, etc. In other words, there’s no one “ideal” digital marketing strategy, as techniques are effective in specific contexts.
The industry is worth US$455.3 billion (2021) in terms of spending and US$340 billion (2020) in terms of market size. It may be a bit surprising that expenses outweigh the market size, but this is not unusual with marketing.
After all, marketing is a non-essential field that doesn’t necessarily bring any actual value to the product. In a way, marketing is the “necessary evil” that all companies have to put up with in order to stay competitive.
They are pretty important because we see that hundreds of billions of dollars are invested each year in this industry. So, digital marketing statistics help investors pinpoint the most effective and efficient strategies in a field where traditionally has a very low return on investment.
Sources
ABOUT AUTHOR
Having spent 7+ years immersed in content marketing, Anastasija has written on any topic you can think of! The industries and companies she's been a part of have shifted her idea about novelty and new challenges - in Canada and overseas. She always strives to go out of her comfort zone and learn about new topics that grow on her. Tech and AI are among these things. Writing about these two topics, I’ve caught myself passionately learning about all the ways that technology can impact and help humanity. And with changes happening continually, you have to be actively involved to stay up to date.